
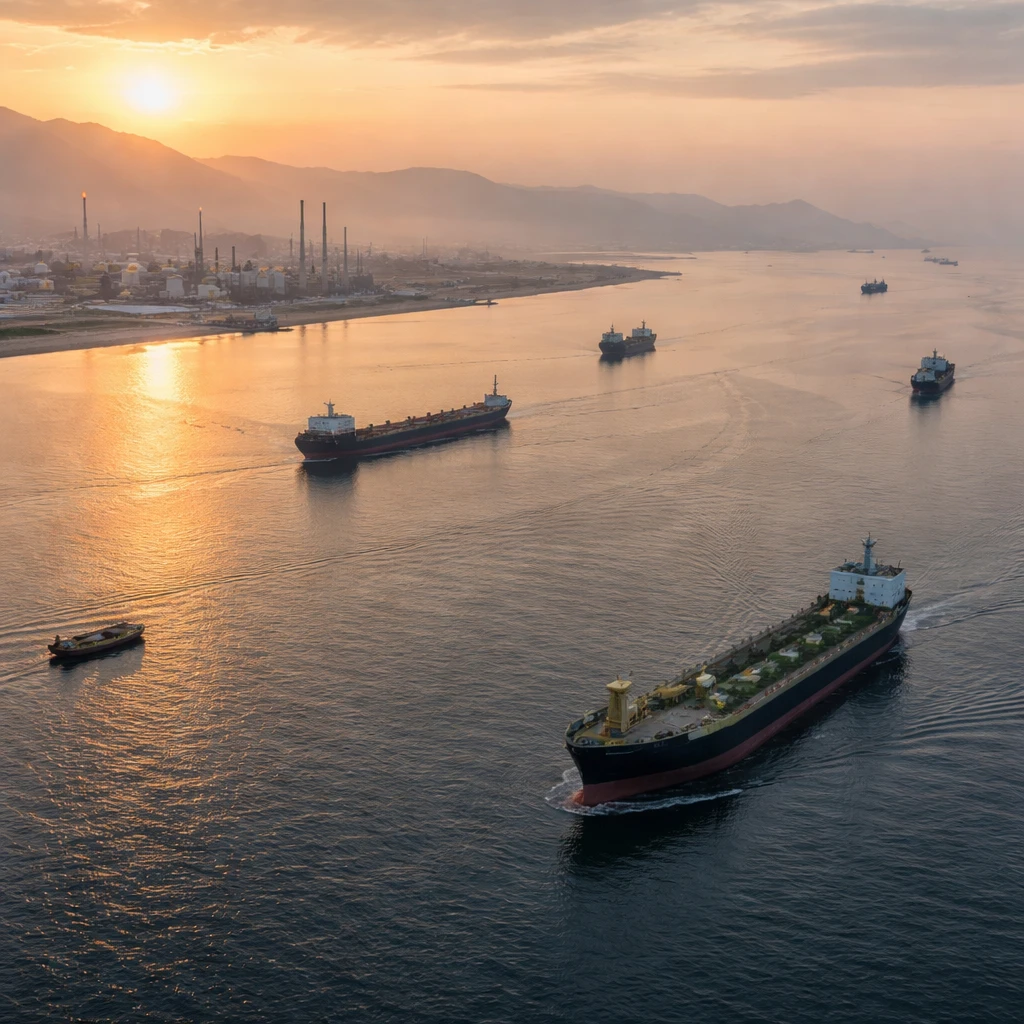
Jefferies disclosed that daily commercial vessel transits through the Strait of Hormuz fell 19% in the last week, leaving average daily traffic at 25 vessels, down from pre-conflict levels of 120 vessels. The decline in traffic comes alongside volatility in freight and energy markets.
Freight rates eased by 30% during the week, yet they remain roughly double the amounts observed at the start of the conflict. Meanwhile, crude stockpiles have been drawn down by about 800 million barrels since the conflict began, supporting a tighter physical market.
Refining economics in Asia showed notable strength. Singapore gross refining margins averaged $21 per barrel over the past week, versus $5 per barrel at the end of February. At the product level, cracks for gasoline, diesel and aviation fuel were reported at $29, $49 and $44 per barrel respectively.
Damage to refining capability has also been material. Jefferies estimates that roughly 3.4 million barrels per day of refining capacity has been damaged since the conflict started, equating to about 3.5% of global refining capacity. That loss of processing availability is consistent with the elevated margins and product crack levels.
Trade flows are shifting as well. India’s share of Russian crude rose from 34% in April to 38% in May. The U.S. sanction waiver on Russian crude expired on June 17. In the pricing backdrop, the Russian Urals discount to Brent widened to $19 per barrel from $14 per barrel the previous week, while Dubai crude traded at a $7 per barrel discount to Brent.
At the retail level in India, oil marketing companies are reporting profits of 7 rupees per liter on petrol and 1 rupee per liter on diesel calculated using 15-day average pricing. Those companies increased retail fuel prices by 8% to 9% during May and June.
Pushing beyond fuels and refining, petrochemical margins were up 101% compared with February levels, and spot liquefied natural gas prices stood at $16 per million British thermal units, a 3% increase week-over-week.
Contextual note - The figures above reflect the data reported by Jefferies covering vessel movements, freight rates, inventory draws, refining margins and product cracks, damaged refinery throughput, trade share shifts, retail margins in India, petrochemical margins and spot LNG levels.