
Latest update: Aug 31, 2026, 07:15 AM UTC. This article is regularly updated during market hours.
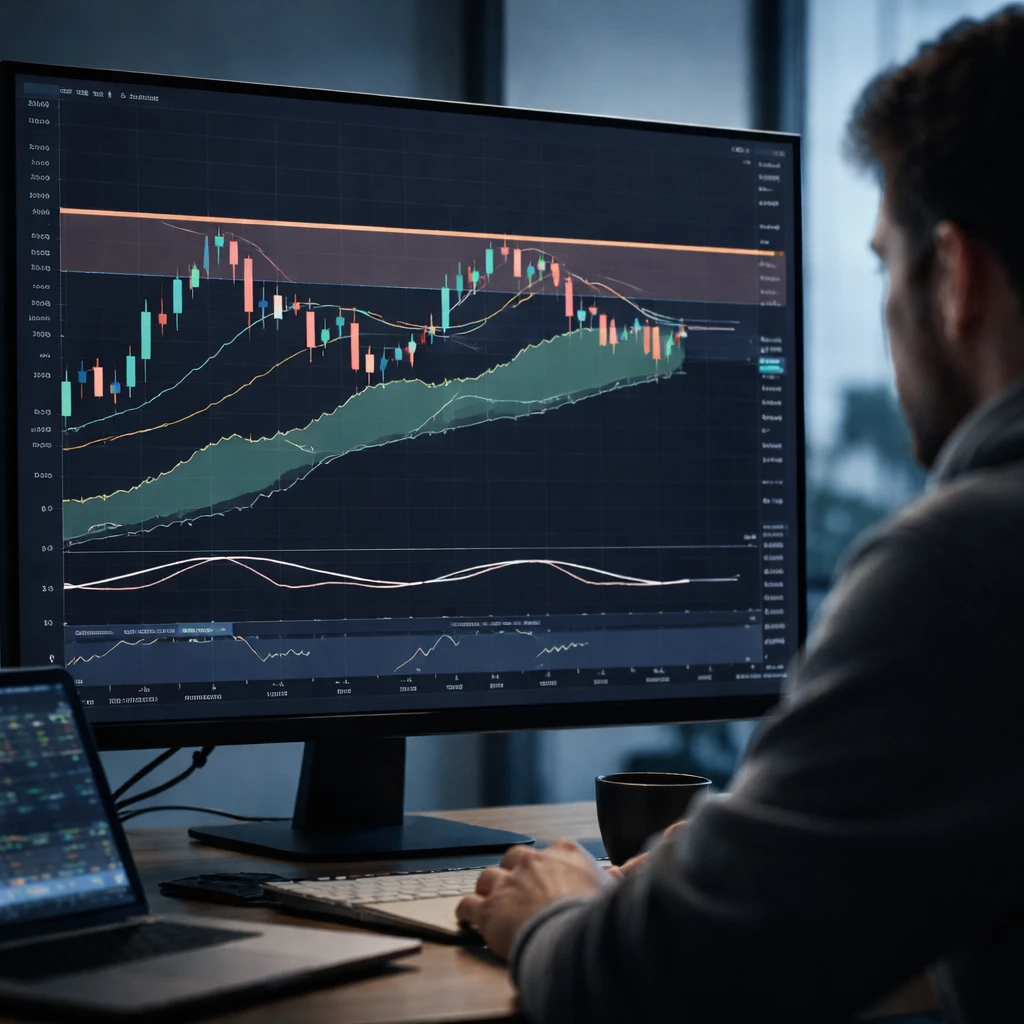
Bitcoin is currently consolidating in a narrow band on the 5-hour chart, roughly between $77,000 and $81,000, as momentum cools and traders await a decisive move. The compression in price action around this range suggests a breakout is forthcoming, but with the market trapped inside technical “fog” there is elevated potential for false breakouts that could trap either side.
Price action is finding support in a cluster of technical levels. The SuperTrend and the lower edge of the Ichimoku cloud converge near $76,200 to $77,000, creating the immediate inflection zone. From a longer-term perspective, the trend remains constructive: Bitcoin remains above the 200-period simple moving average, which sits at $67,890. That level underlines the broader bullish bias, even as short-term momentum indicators have shifted against buyers.
Key momentum readings show a transition to bearishness on shorter timeframes. The MACD has crossed into bearish territory - reported as 107.27 less than 307.61 - and the RSI has eased to 44.44, reflecting seller initiative. These readings indicate that, while the broader trend is intact, near-term directional conviction is lacking.
Decision thresholds
- Bull case invalidation: a drop below $76,200.
- Bear case invalidation: a reclaim of $79,000.
Scenario playbook - practical setups spanning aggressive and conservative approaches are presented below to match different trader preferences and risk tolerances.
| Bull (Aggressive) | Bull (Conservative) | Bear (Aggressive) | Bear (Conservative) | |
|---|---|---|---|---|
| Entry | $77,000 | $78,700 | $77,400 | $76,000 |
| Stop | $75,600 | $75,600 | $77,500 | $77,500 |
| Targets | $79,100 / $81,300 / $85,000 | $79,100 / $81,300 / $85,000 | $73,750 / $72,350 / $69,580 | $73,750 / $72,350 / $69,580 |
| Risk/Reward | 1.5 / 3.1 / 5.7 | 1.5 / 3.1 / 5.7 | 1.5 / 2.4 / 4.3 | 1.5 / 2.4 / 4.3 |
| Confidence | Medium | Medium | Medium | Medium |
| Best for | Dip buyers | Confirmation traders | Breakdown traders | Breakdown chasers |
Rationale for entries: bullish entries target likely bounce or trend-resumption levels. The conservative bull setup requires a confirmed move above the Ichimoku cloud top and the 20-period moving average. Bearish entries are designed to exploit a clean breakdown beneath the Ichimoku cloud and SuperTrend support, which would open room for further downside.
Pattern watch and volatility traps
The chart currently resembles a bull flag that is about 70% complete, but the pattern is trapped inside the Ichimoku cloud range of $77,000 to $78,600 - a chop zone where directional bias is unclear. The presence of Doji candlesticks in this band signals indecision, increasing the likelihood of fake-outs before a sustainable move materializes. Because of that, the recommended no-trade zone is $77,000 to $78,600 to avoid whipsaw risk.
Average True Range is quoted at 900.86, roughly 1.2% of price, implying a potential surge of volatility on any decisive breakout from the current compression.
Risk management
- Preservation alert: Support at $76,200 is the last defensive line for bulls - if that level gives way, short-term momentum could shift quickly.
- Bear trap potential: Aggressive short positions risk being squeezed if a breakdown proves false and buyers reclaim the cloud.
- Trade management rules: For bullish trades, move the stop to breakeven after the first target is hit. For bearish trades, start trailing stops using ATR once the first target is reached.
Key lesson: When price is inside the Ichimoku cloud, directional clarity is low. Both buyers and sellers are susceptible to false signals in the fog. The practical approach is to wait for clean breaks and confirm them with momentum indicators rather than guessing direction while price remains choppy.
Market snapshot shown in the trading interface indicates a Bitcoin US Dollar quote at 78,251.00, up 124.0, or +0.16% in real-time data. The platform suggests chart analysis tools and lists Bitcoin among AI-picked strategies.
All levels, indicators, and suggested trade parameters above are based on the current technical readings and should be monitored as price progresses through the highlighted inflection zones.
Reporting and analysis by Ajmal Hussain.