
Latest update: Aug 10, 2026, 02:16 PM UTC. This article is regularly updated during market hours.
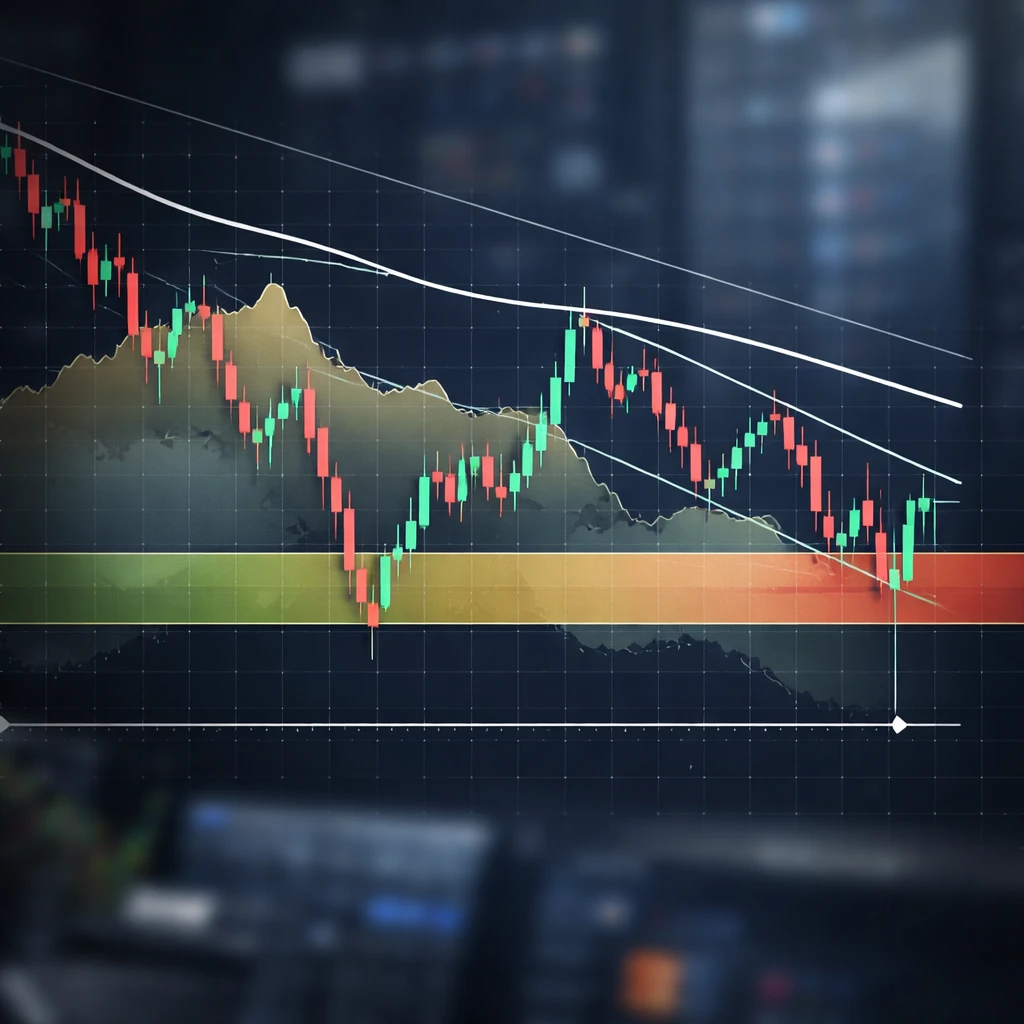
Intel's short-term chart dynamics point to an ongoing tussle between sellers and buyers. On the 5-hour timeframe, price recovered from a low of $96.51 up to $97.99, yet that move landed squarely inside a bearish flag that sits within a broader downtrend. The most important technical reference remains the 200-period simple moving average (SMA) at $100.64, which has acted as resistance after a rejection at $101.65.
Cloud congestion and resistance
The stock is currently working through the Ichimoku cloud, with a critical resistance band running from roughly $96.00 to $100.00. That range represents an area of indecision where traders can become trapped on either side. On the 5-hour chart the bear flag pattern remains intact after the price was turned away at $101.65.
Momentum indicators offer mixed signals. The MACD retains a mild bullish tilt (0.73 > -0.31), but trend conviction is weak with the ADX reading at 17.94. Average True Range (ATR) sits at $4.42, implying typical daily swings of about 4.5% and underscoring elevated short-term volatility.
Bear playbook - setup and trade management
Traders looking to structure a short have two principal approaches shown below. Both approaches preserve the same target levels but differ on entry timing and risk posture.
- Aggressive entry - Enter near live resistance around $97.99; stop at $100.00. Targets: $91.00, $86.00, $81.81. Risk/reward: 2.3 / 4.2 / 5.7. Confidence: Medium. Best for active traders willing to accept a near-term squeeze risk.
- Conservative entry (on loss of support) - Wait for a confirmed breakdown below $94. Entry at $94; stop at $100.00. Targets: $91.00, $86.00, $81.81. Risk/reward: 1.0 / 3.0 / 5.0. Confidence: Medium. Best for risk-averse traders who demand confirmation of downside momentum.
Practical trade management notes: take partial profits at $91 and move the stop to breakeven. Consider employing trailing stops as price approaches $86. The bearish thesis would be invalidated by a close above $100 - traders should prepare to reassess and only consider reentry above $102.
Chart reading - support, danger zones and pattern context
- Support: $91.00, referenced as a level with multiple touches.
- No-trade zone: $96.00 - $99.50, described as mid-cloud congestion that can trap both bulls and bears.
- Pattern: An active bear flag with falling volume on approach to resistance, characterizing a classic short-term trap for late buyers.
Key takeaway: the technical picture favors the bears while price remains capped below the 200 SMA and inside the Ichimoku cloud. The first clear sign that a bullish reversal is underway would be closes above $101.50 accompanied by meaningful volume.
Price action and indicators on the 5-hour chart suggest that downside control persists until buyers can convincingly reclaim space above the $100 area.