
Market snapshot
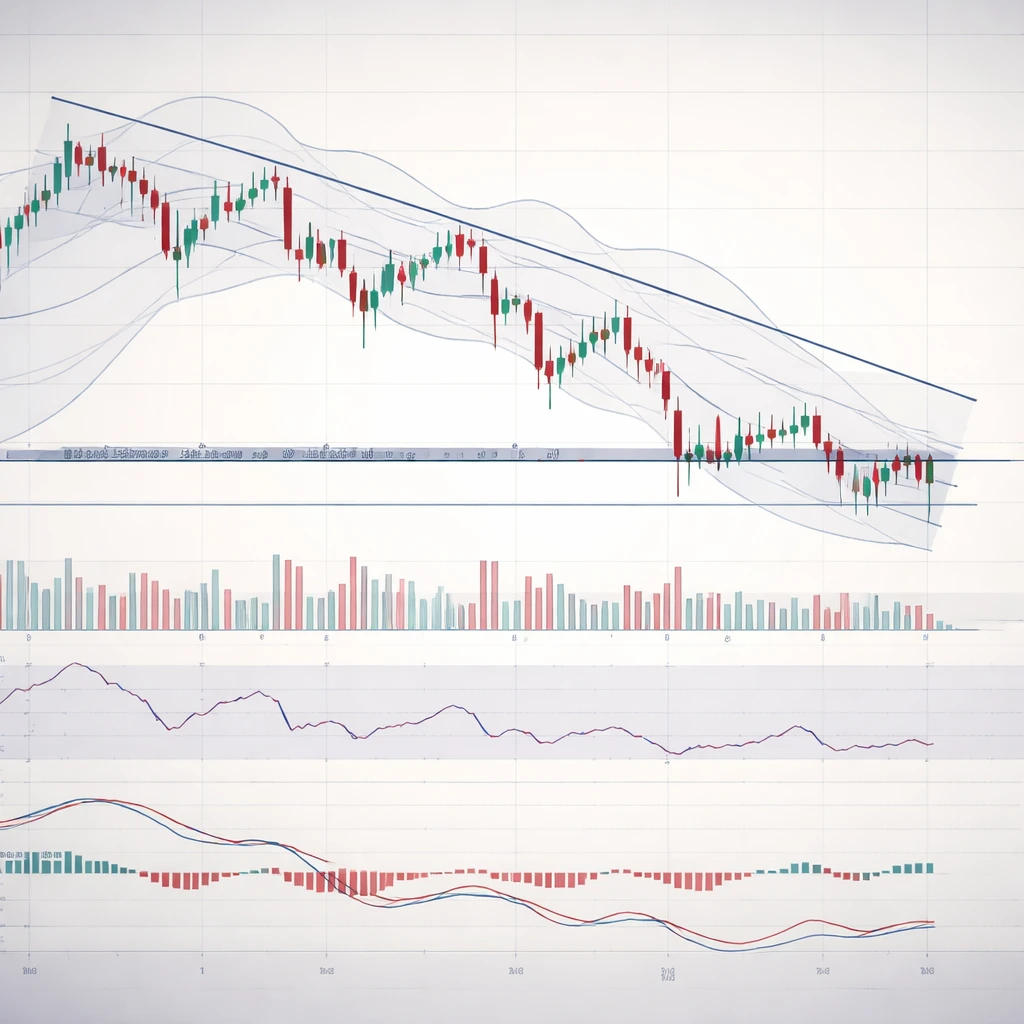
On the 5-hour timeframe, Alphabet C is testing a crucial support level roughly at $330.61 while a new candle is forming just above the make-or-break $329 threshold. The chart is configured as a descending triangle with resistance compressing down from about $342 and the pattern roughly 90% complete after four clear bounces between the support and resistance lines.
Technical compression and indicator readings
Price action is currently hugging the lower Bollinger Band and probing the 78.6% Fibonacci retracement. The Relative Strength Index stands at 37.45, which suggests selling pressure may be nearing exhaustion, but volume has been declining. That mix - low volume together with indicator readings nearing oversold territory - often precedes sharp directional moves.
Trend framework
Downside momentum remains in control. The SuperTrend indicator is negative at 341.84, and the price sits well below both the 20-period and 50-period simple moving averages, reinforcing the downtrend. MACD momentum is deteriorating, with the MACD line at -2.47 and positioned below its signal line, which corroborates sustained bearish control. A recent bearish candlestick close also applied fresh pressure to the $329 support band.
Potential paths: breakdown versus failed breakdown
A decisive close beneath $329 would raise the probability of a sharper decline toward the $320 area and, in an extended move, $315. Conversely, if volume does not expand during a move below support, traders should be alert to the possibility of a rapid bear-trap reversal. In short, volume is the key confirming variable for any sustained move.
Trade scenario playbook
| Aggressive Bearish | Conservative Bearish | Aggressive Bullish | Conservative Bullish | |
|---|---|---|---|---|
| Entry Level | $329.50 close < $330 | $328 retest | $331 engulfing | $343 close > $342 |
| Stop Level | $335.20 | $335.20 | $325.30 | $325.30 |
| Target Zones | $320 / $315 / $305 | $320 / $315 / $305 | $342 / $355 / $365 | $342 / $355 / $365 |
| Risk/Reward | Up to 4.3 | Up to 4.3 | Up to 5.96 | Up to 5.96 |
| Confidence | Medium | Medium | Low | Low |
| Best for | Trend followers | Patient traders | Countertrend tact. | Breakout chasers |
Current readings and what to watch
Current price: $331.64 (last bar forming; not a settled close). Another intraday snapshot in the feed showed 333.29, down 2.03 or -0.60%, reflecting short-term variation between live updates.
- Decision zone: $329 to $330 is the immediate area of interest where direction should clarify.
- Upside trigger: a move above $342 is needed for the bull case to regain credibility.
- Bear-trap caveat: if a break under support occurs without a volume surge, a swift snapback is possible.
Practical takeaway
The band between $329 and $338 functions as a 'no-trade' zone because it is prone to false breakouts and whipsaws. Waiting for a clean, volume-confirmed signal is the prudent approach to avoid being whipsawed.