Hook & thesis
Allison Transmission (ALSN) is a mature industrial business that consistently converts strong margins into cash and uses that cash to buy back stock and raise dividends. With a market cap near $10.46 billion and trailing earnings of $7.49 per share (P/E ~17), Allison is trading at an attractive multiple for a company with a 33% return on equity and $661 million in free cash flow. The recent push on buybacks and a raised repurchase authorization, combined with a resilient Defense backlog and an expanding electrified propulsion product set, creates a favorable risk/reward for buyers.
Why the market should care
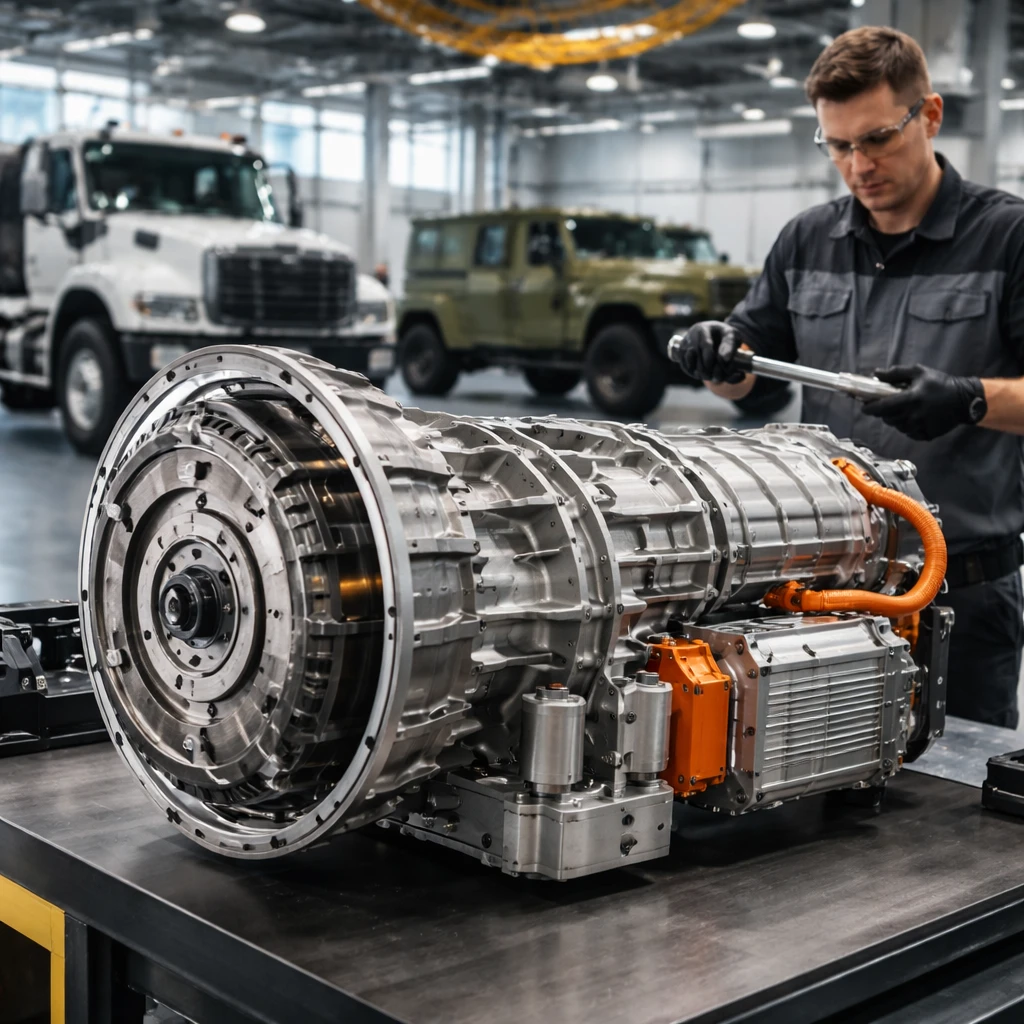
Allison designs and manufactures automatic transmissions and electrified propulsion systems for commercial and defense vehicles. Its products are mission-critical for buses, medium- and heavy-duty trucks, motorhomes and off-highway equipment. That mix gives Allison exposure to both cyclical fleet spending and non-cyclical defense demand. Investors should care because Allison converts revenue into cash at scale: the company reported $661 million of free cash flow, while maintaining a high operating margin profile - management has shown the willingness to return excess cash via dividends and buybacks, which materially reduces share count and boosts per-share outcomes.
The fundamentals in numbers
Key figures that underpin the thesis:
- Market capitalization: $10.46 billion.
- Trailing earnings per share (EPS): $7.49; P/E approximately 17.1.
- Free cash flow: $661 million (most recent full-year figure).
- Enterprise value: $12.06 billion; EV/EBITDA roughly 11.7.
- Return on equity: 33.37%; return on assets: 10.24%.
- Debt-to-equity: 1.55 (company carries financial leverage but also generates strong returns).
- Shares outstanding: ~83.13 million; management has reduced shares meaningfully over the last decade and recently increased repurchase authority by $1 billion.
- Dividend: $0.29 per quarter (most recent distribution), with a recent 8% dividend increase announced earlier.
Those numbers paint the picture of a cash-generative industrial that returns capital to shareholders while reinvesting selectively in electrification and defense. The stock sits near $125.83 today, close to its 52-week high of $130.83 and well above the 52-week low of $76.01, showing recovery since last year’s trough.
Valuation framing
At a market cap of $10.46B and EPS of $7.49, the P/E around 17 is below many software or growth names but reasonable for a high-return industrial. EV/EBITDA of 11.7 implies the market is paying a healthy multiple for stable margins and predictable aftermarket revenue. The more important frame is cash return: $661M of free cash flow against a market cap of $10.46B is roughly a 6.3% free cash flow yield before buybacks – not cheap, but augmented by a material buyback program and steady dividend increases. Given Allison’s 33% ROE and historically high margins, a mid-to-high-teens P/E is justified; the current level offers upside if operating trends normalize and buybacks continue.
Catalysts to realize upside
- Buyback acceleration - management increased repurchase authority by $1 billion and has been an active buyer of shares; ongoing repurchases should boost EPS and support the multiple.
- Defense demand - Defense segment growth can be a reliable offset to on-highway cyclicality; the Defense business grew strongly in past periods and can drive margin expansion.
- Commercial electrification adoption - Allison’s electrified propulsion systems are a differentiator as fleets adopt hybrid and electric powertrains; accelerating content per truck could expand addressable market and margins.
- Event flows - industry showcases such as Work Truck Week (Ride & Drive) increase visibility for Allison’s electrified and advanced products, potentially translating into new contracts.
Trade plan (actionable)
Direction: Long.
Horizon: long term (180 trading days) - I expect the combination of buybacks, steady FCF and positive product adoption to play out over several quarters and for the market to re-rate the multiple within this window.
Entry: $125.835
Target: $150.00 (exit at roughly +19% from entry)
Stop loss: $115.00 (cut loss at roughly -8.6%)
Why these levels? Entry at $125.835 is essentially the current market price and buys the stock on a P/E of ~17 with a free cash flow yield north of 6% before buybacks. The $150 target assumes an expansion to a P/E in the low-20s on improved sentiment and continued buybacks, or a modest earnings beat and multiple re-rating. The $115 stop protects capital if demand deteriorates or if the cyclical headwinds re-intensify - that price would represent a breakdown below short-term moving averages and would indicate that the thesis (stability of margins and buyback support) is no longer intact.
Position sizing & risk management
Given the company’s leverage (debt-to-equity ~1.55) and exposure to trucking cycles, position sizing should reflect a medium risk tolerance. Consider sizing to no more than 2-4% of total portfolio risk capital on an individual trade; use the stop to keep absolute dollar drawdown within plan.
Technicals & market context
Technically the stock has momentum: the 10- and 20-day SMAs sit below current price and the RSI is ~60.8, indicating room to run without being overbought. Short interest measured in days to cover is low (~2.97 most recently), so any positive surprise is less likely to trigger a violent short squeeze, but continued buyback announcements and improved fundamentals can still lift the multiple steadily.
Risks & counterarguments
- Cyclicality of on-highway demand: A meaningful pullback in trucking orders or a macro slowdown would compress revenue and margins. On-highway sales have shown volatility historically and were called out in prior quarters as a weak spot.
- Leverage profile: Debt-to-equity is ~1.55. A sharp revenue decline could strain the balance sheet and reduce optionality for buybacks or dividends.
- Technological transition risk: Electrified propulsion is a growth opportunity, but it requires successful execution. If competitors capture the high-value e-axle market or Allison’s R&D misfires, unit economics could suffer.
- Commodity and supplier constraints: Transmission production is exposed to raw material and supplier cost swings; input inflation or supply disruption could hit margins.
- Overhang from cyclical investors: Large institutional sellers or negative fund flows (some funds have reduced exposure in the past) could pressure the stock despite stable fundamentals.
Counterargument: Critics will point to recent quarter-to-quarter variability in on-highway sales and the company’s reliance on buybacks to lift per-share metrics. If underlying demand fails to recover, buybacks can mask deteriorating fundamentals temporarily but not indefinitely. A flat-to-down revenue trend coupled with higher interest rates would compress margins and could push the stock lower despite a pro-shareholder capital return program.
What would change my mind
If Allison shows a persistent decline in free cash flow (several quarters of FCF below prior-year levels) or if leverage increases materially without a clear plan to deleverage, I would step back. Conversely, signs of accelerating content per vehicle for electrified propulsion, a string of Defense contract wins, or a sustained acceleration in buyback activity would make me more bullish and likely raise the target toward $165+.
Conclusion
Allison Transmission is a pragmatic buy for investors who want exposure to a cash-rich industrial with a sensible capital-return program and durable end-markets. The numbers - $661M in free cash flow, 33% ROE and a P/E near 17 - support a favorable reward-to-risk for a 180-trading-day trade. The plan above gives a disciplined entry at $125.835, a protective stop at $115.00, and a target of $150.00 that reflects modest multiple expansion plus earnings leverage. Monitor order trends in on-highway markets, defense bookings and share repurchase cadence to validate the trade over the holding period.
Trade idea timestamp: 04/15/2026 - execute with position sizing appropriate to your risk tolerance.